
Zarella

Abstract
The Purpose & the Problem - Zarella is a sustainable e-commerce platform aiming to provide their customers with a one-stop shop for all of their purchasing needs. Due to the relatively novel nature of the platform, the leadership team at Zarella found themselves at a loss for how to create the best user experience for their customers. Overall, they are looking to improve their website while adhering to their sustainable mission and continually adapting to stakeholder needs.
What We Found & What We Did - My team designed a plan that would allow us to deliver a user-driven solution to the Zarella development team. Through our research, we discovered that users needed a way to track and visualize their savings because they lacked the confidence to calculate their own environmental impact and the motivation to the take that extra step. We designed an account feature that allows users to actively keep track of and visualize their carbon savings through shopping at Zarella.com.
The team
2 Researchers, 2 Designers
MY Contribution
UX and Graphic Design
Medium
Desktop
Techniques
Sketching
User Interviews
Competitive Analysis
Feature Prioritization
Wire-framing
Usability Testing
Tools
Adobe Illustrator
Procreate
Figma
What’s the problem?
Zarella has a beautiful vision and an excellent mission statement, so what’s the problem? They’ve noticed a handful of hiccups on their current platform.
1. Conceptualizing - The process of certifying a piece as sustainable can be complicated. Zarella is worried that their shoppers won’t understand the impact of their purchase and will ultimately lack the motivation to continue to shop on their platform.
2. Wish Lists - Zarella has heard from their customers that the wishlist feature is confusing, both for the initial user who adds the items and for subsequent users who try to shop from that list.
3. Accessibility - Cost is a huge barrier to shopping sustainably. Zarella wants to make sure that their platform is accessible to people from all economic backgrounds. They came up with a brilliant plan - translating carbon savings into currency! The more you save, the more you save. It’s a great idea and they are currently in conversation with different companies who are willing to accept this new type of capital. But how do we, both the user and Zarella, keep track of carbon savings?
First step, research
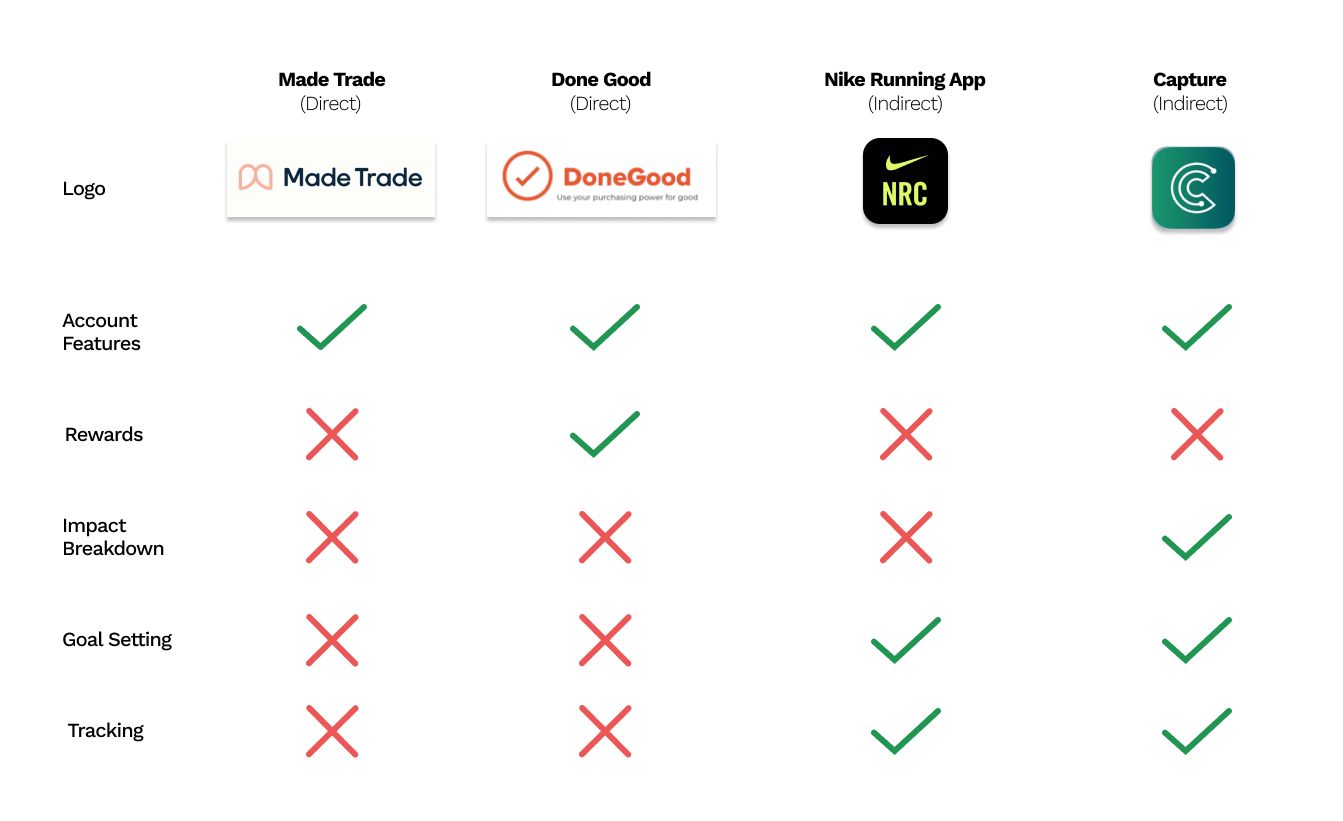
Researching the competition - I conducted a comparative and competitive analysis in order to identify opportunities and understand currently available products.
Researching Zarella - I created a site map and user flow of Zarella’s current product to better understand the current user experience.

Researching the user - Our goal was to understand how consumers think about shopping and sustainability. We had many different possible paths to explore but, in order to create the most efficient product, we wanted to follow users’ direction.
We interviewed 10 individuals who were over the age of 18, had experience with e-commerce shopping, and were, on some level, curious about sustainability. After we completed the interviews, our research team made an affinity map of responses. This map helped us visualize patterns and shared experiences among our diverse group of interviewees. From this map we were able to validate or invalidate our possible solutions.
Conceptualizing/Visualizing Savings - Valid
“I haven’t measured my carbon impact because I never had the confidence that I would be calculating it correctly and I don’t have enough knowledge about it.”
Wish Lists - Invalid
"I don't recall using wishlist functions. Seems like more steps." (User uses cart in lieu of a wishlist.)
"I like to keep my purchases in cart for "save for later" option."
Rewards/Accessibility - Valid
“It’s a motivating reward if it’s giving you something back that you’ll remember to use.”
“I think the biggest barrier to shopping sustainably is expense. It’s really hard to beat the price point of cheap items.”
Defining the problem
Using the insights we gained during our user research, the team workshopped a problem statement. This statement helped direct our solutions and our scope.
Sustainable shoppers need a way to track and visualize their savings because they lack the confidence to calculate their own impact and the motivation to take that extra step.
Designing user-driven features
I worked on designing possible flows that would help ameliorate the reported pain points of ethical online shopping: impact and motivation.
Visualizing the product
My design partner and I conducted design studios and iterated the prototype throughout the project. During our initial meeting, we rough-sketched some concepts for our proposed features. We took these designs to the leadership and development teams at Zarella. As a group, we chose the design that best fit the company vision as well as the design system already established by their development team.

Design Evolution
We conducted usability testing after each round of iterations to identify areas where the current design was succeeding or falling short of the users’ needs. As a design team, we wanted to create a product that was cohesive with the rest of the Zarella brand - honest, green, and playful.
Account page


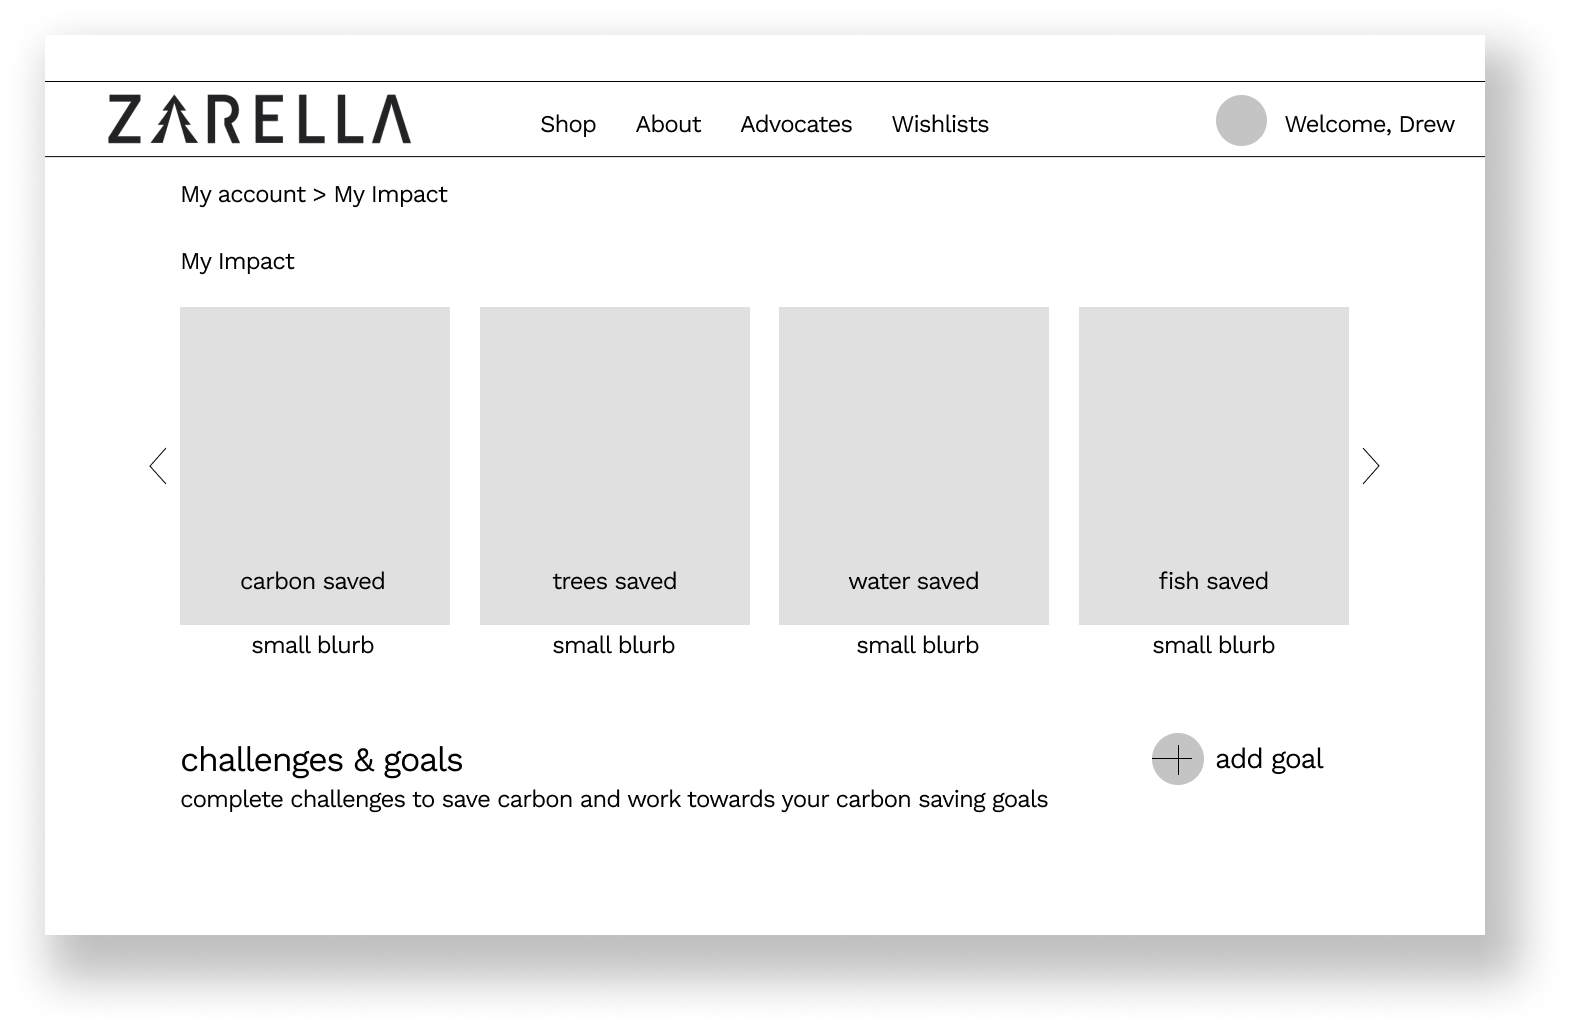
impact page


Goals & Challenges Page


Testing the Prototype
This round of testing was aimed at understanding how our potential users interact with this version of the application.
Do users understand how to navigate the account page?
Are users able to participate in carbon-saving challenges?
Do users trust that the metrics they see are accurate?
We interviewed five individuals who had experience shopping on an e-commerce platform and had access to the internet.
Task Scenarios
You are a returning Zarella customer. Could you show me how you would login to your account and access your account profile?
Where would you locate your carbon savings to date and can you tell me your current level of carbon savings?
You are interested in increasing your level of carbon savings. Can you show me how you would complete a challenge to increase your carbon savings?
Now that you have completed the challenge, can you tell me your current level of carbon savings?
You want to participate in more challenges. Show me how you would complete the Valentine’s Day challenge.
Can you tell me how you would track the changes in your carbon savings after completing your second challenge?
Users felt comfortable with the way their carbon savings were displayed and encouraged by their increased savings.
“It made me feel like I accomplished something by looking at the levels.”
“This was a very new experience site for me. I never was exposed to sustainable measuring websites and it was visually easy to follow the changes.”
User responses
While users enjoyed watching their carbon savings increase, they were not confident that the information being displayed was accurate. A large part of this could be due to the fact that during the usability test the users did not actually complete a challenge and so were not able to relate their experience to the value displayed in their account.
“I would like to see more details about carbon saving.”
“I don't see a definition for a unit of carbon. I want a better understanding.”
We hope that building out each of the challenges and generating active user participation will decrease the disconnect. In addition, we plan on adding more details about what each unit of carbon represents and allowing users to dive deeper into the science behind it if they choose to do so.
looking forward
This is an ongoing project with Zarella and their development team. We are currently in the process of iterating the design based on the feedback from our user interviews.
Please check back to see how this project progresses!

Thanks for visiting!
Please feel free to contact me to learn more about my work.